CyberDragon Core is live — indigenous SIEM/SOAR with Edge protocol capture. Start a 7-day free trial on your own traffic →
Platform

One platform. Two planes. Complete visibility.

CyberDragon Core runs the SOC control plane. CyberDragon Edge deploys passively at the plant DMZ. Telemetry flows up only — there is no cloud command plane into Purdue L0–L2.

Architecture

Two planes. One rule: telemetry only ever flows up.

CyberDragon Core is the indigenous SIEM/SOAR and cyber threat intelligence control plane. CyberDragon Edge is the on-site industrial collector. Together they cover Purdue L0–L5 without opening a command plane into process networks.

Control plane · SIEM + SOAR

CyberDragon Core

~62 microservices behind a single reverse proxy — sovereign identity, ingest, threat intel fusion, kill-chain detection, risk, compliance, Temporal-orchestrated response, and the evidence vault. Built as a global-ready cyber defense plane for MSSPs and sovereign operators alike.

  • · Kafka ingest → normalize → detect → correlate
  • · Neo4j attack-path graph
  • · Hash-chained, Ed25519-signed evidence
  • · Hybrid ML-DSA-65 + Ed25519 session identity
  • · OPA OT Safety Gate (deny after approve)

Core deep dive →

On-site plane · Industry 4.0 / ICS

CyberDragon Edge

Deploys once at the plant DMZ (IEC 62443 L3). Sees every Modbus write, DNP3 command, and OPC-UA session change — without a single agent on a PLC, robot controller, or medical device.

  • · Passive libpcap capture, never injects packets
  • · SQLite WAL offline buffer, ~5,000 events
  • · HMAC-SHA256 + mTLS transport to Core
  • · Local YAML + behavior detection
  • · Purdue zone policy at the boundary

Edge deep dive →

Pipeline

Capture → buffer → transport → enrich → correlate → decide → seal

1. Capture

Edge mirrors traffic from a SPAN port or hardware TAP at the industrial DMZ and parses OT protocols locally.

Control plane

Unified SOC for Core + Edge

  • One indigenous SIEM/SOAR plane for converged enterprise and OT.
  • KPI cards for incidents, risk, compliance, and active threats.
  • Click through to Core modules without leaving the operator narrative.
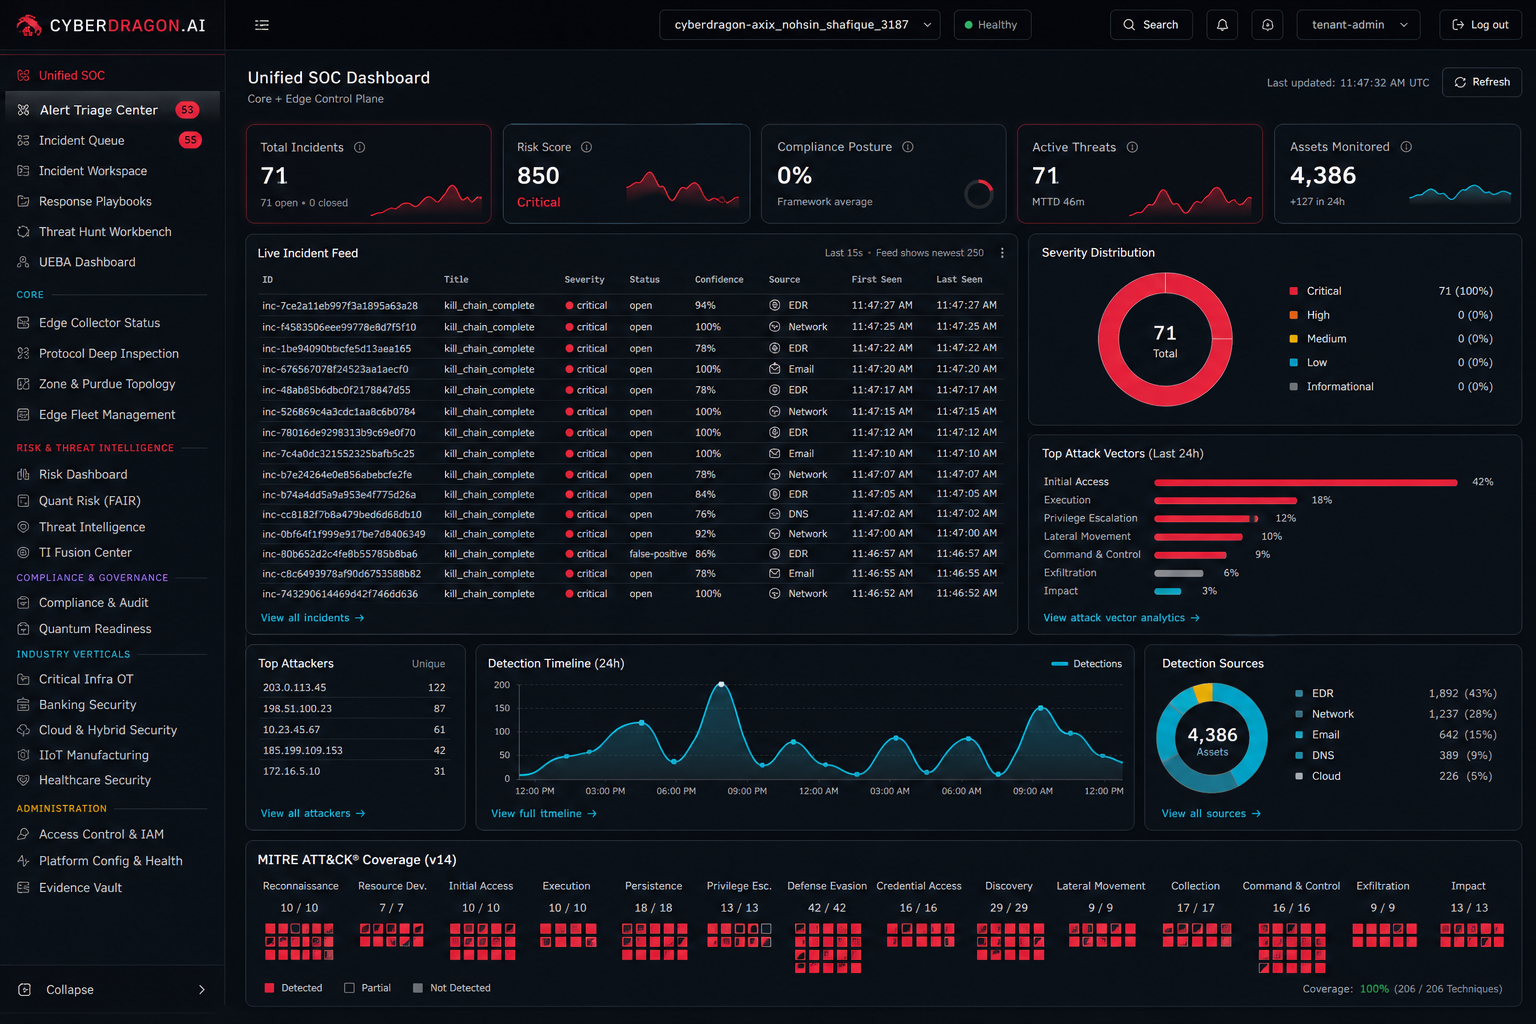
CyberDragon Unified SOC dashboard
Data pipeline

Edge / connectors → ingest → Kafka → detect → evidence.

Edge and enterprise connectors feed ingest. Kafka normalizes. TI fusion enriches. Detection correlates. Graph, risk, compliance, response, and the evidence vault sit downstream — then public API and UIs.

01

Edge / Connectors

02

Ingest

03

Kafka

04

Normalize

05

TI Fusion

06

Detection

07

Graph · Risk · Compliance · Response · Evidence

08

Public API → UIs

On-site plane

Edge collector at Purdue L3

  • Passive capture only. Telemetry flows up. Command plane into L0–L2: none.
  • Node health, certs, firmware, and parser throughput in one board.
  • If Core connectivity drops, Edge buffers events locally.
CyberDragon Edge collector status board
Core modules

Fifteen modules — led by what actually ships.

LIVE ships today. PARTIAL is real but hardening. ROADMAP is labeled.
Explore Now →
Explore Now →
Explore Now →
Explore Now →
Explore Now →
Explore Now →
Explore Now →
Explore Now →
Explore Now →
Explore Now →
Explore Now →
Explore Now →
Explore Now →
Explore Now →
Explore Now →

Investigation

Incident workspace

  • Timeline, MITRE, attack path, and TI enrichment on a single incident.
  • Notes and playbook panel stay with the kill chain — not a separate ticket silo.
  • OT Safety Gate still applies after a human approve.
CyberDragon Incident workspace
Edge capabilities

Deploy once at the plant DMZ. See every OT write.

Explore Now →
Explore Now →
Explore Now →
Explore Now →
Explore Now →
Explore Now →
Explore Now →

OT wire

Protocol deep inspection

  • Modbus, DNP3, OPC-UA, and MQTT parsed natively at the Edge.
  • See writes and session changes without agents on PLCs.
  • Same inspector feeding the Core SIEM pipeline.
CyberDragon Protocol deep inspector
User interfaces

Analyst Copilot, Tenant Admin, MSSP Portal, Edge Dashboard.

Explore Now →
Explore Now →
Explore Now →
Explore Now →
Analyst console tour

SOC, Edge, risk, compliance, verticals, executive, MSSP.

Explore Now →
Explore Now →
Explore Now →
Explore Now →
Explore Now →
Explore Now →
Explore Now →
Feature maturity

Lead with LIVE. Label roadmap clearly.

FeatureStatusWebsite treatment
Incident QueueliveShow prominently
Login / JWT / MFAliveShow prominently
Evidence verify/exportliveShow prominently
Tenant create/suspendliveAdmin section only
Unified SOC DashboardpartialEnhanced / hardening
Incident Detail / Attack GraphpartialReal screenshots when available
Risk / Compliance DashboardspartialFramework cards
Threat Hunt / UEBAroadmapComing soon
AI Copilot ChatroadmapComing soon
MSSP PortalpartialPartner page
Edge Analyst UI routesroadmapUse local Edge Dashboard
Technology stack

Built on enterprise-grade primitives.

Kafka
PostgreSQL
Neo4j
Temporal
OPA
HashiCorp Vault
React
nginx
FAQ

Frequently asked questions.

What is the difference between Core and Edge?
Core is the SOC control plane — around 62 microservices for identity, ingest, detection, risk, compliance, response, and evidence. Edge is the passive on-site collector at the plant DMZ.
How many Edge collectors do we need?
One per monitored boundary or site to start. Fleet identity scopes each collector to a tenant, so you can grow site by site.
Does the platform ever write to OT devices?
No. Telemetry flows up only. There is no command plane into Purdue L0–L2, and OT-affecting actions require human approval plus an independent OPA decision.

Request a technical deep-dive.

Start a 7-day free trial and walk the dual-plane architecture on your own traffic.